查询日志
创建 Index Pattern
Nginx 访问日志经过收集、过滤、索引后就可以通过 Kibana 查询,但是查询之前需要指定索引 index pattern:
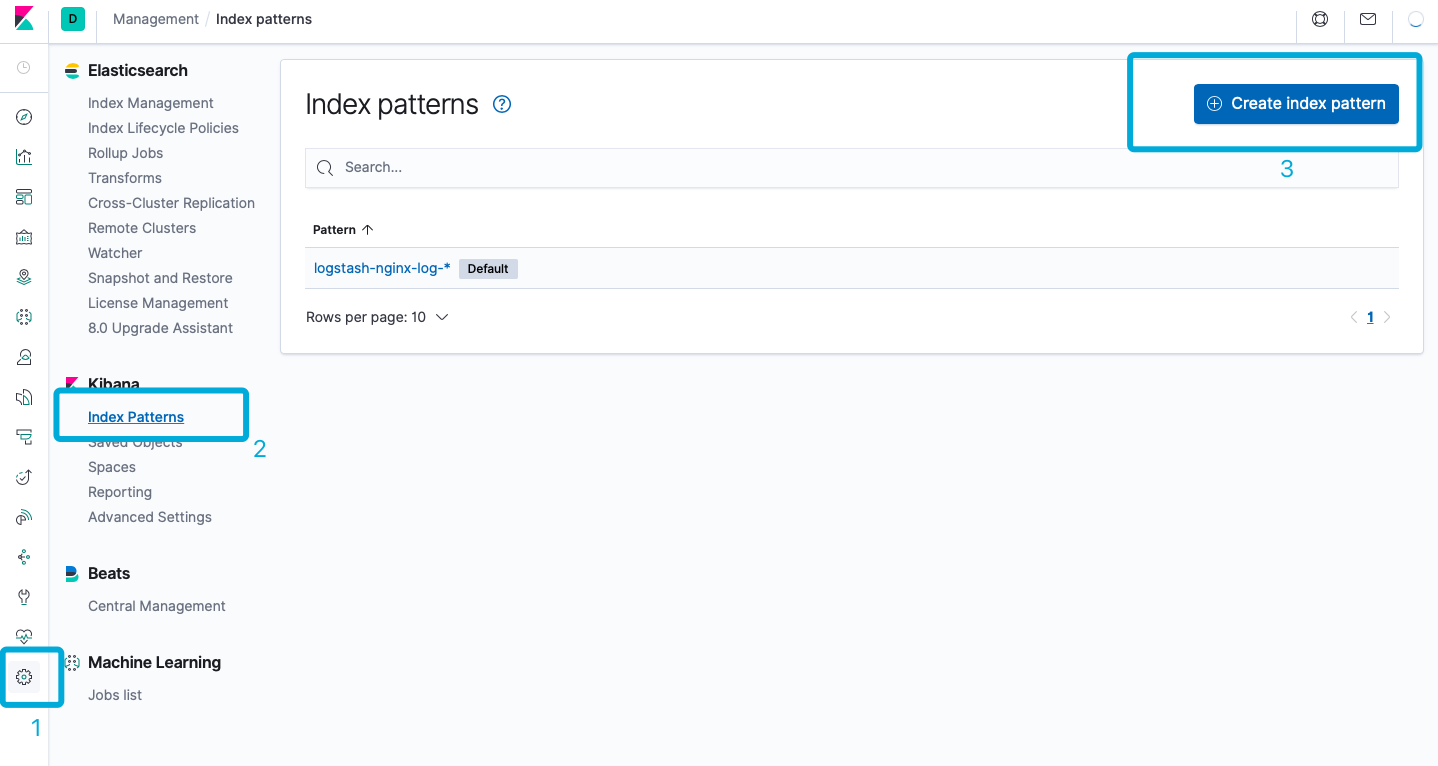
如上述截图示例,在 Kibana 管理 > Index Patterns > Creata Index Pattern 进入创建页面:
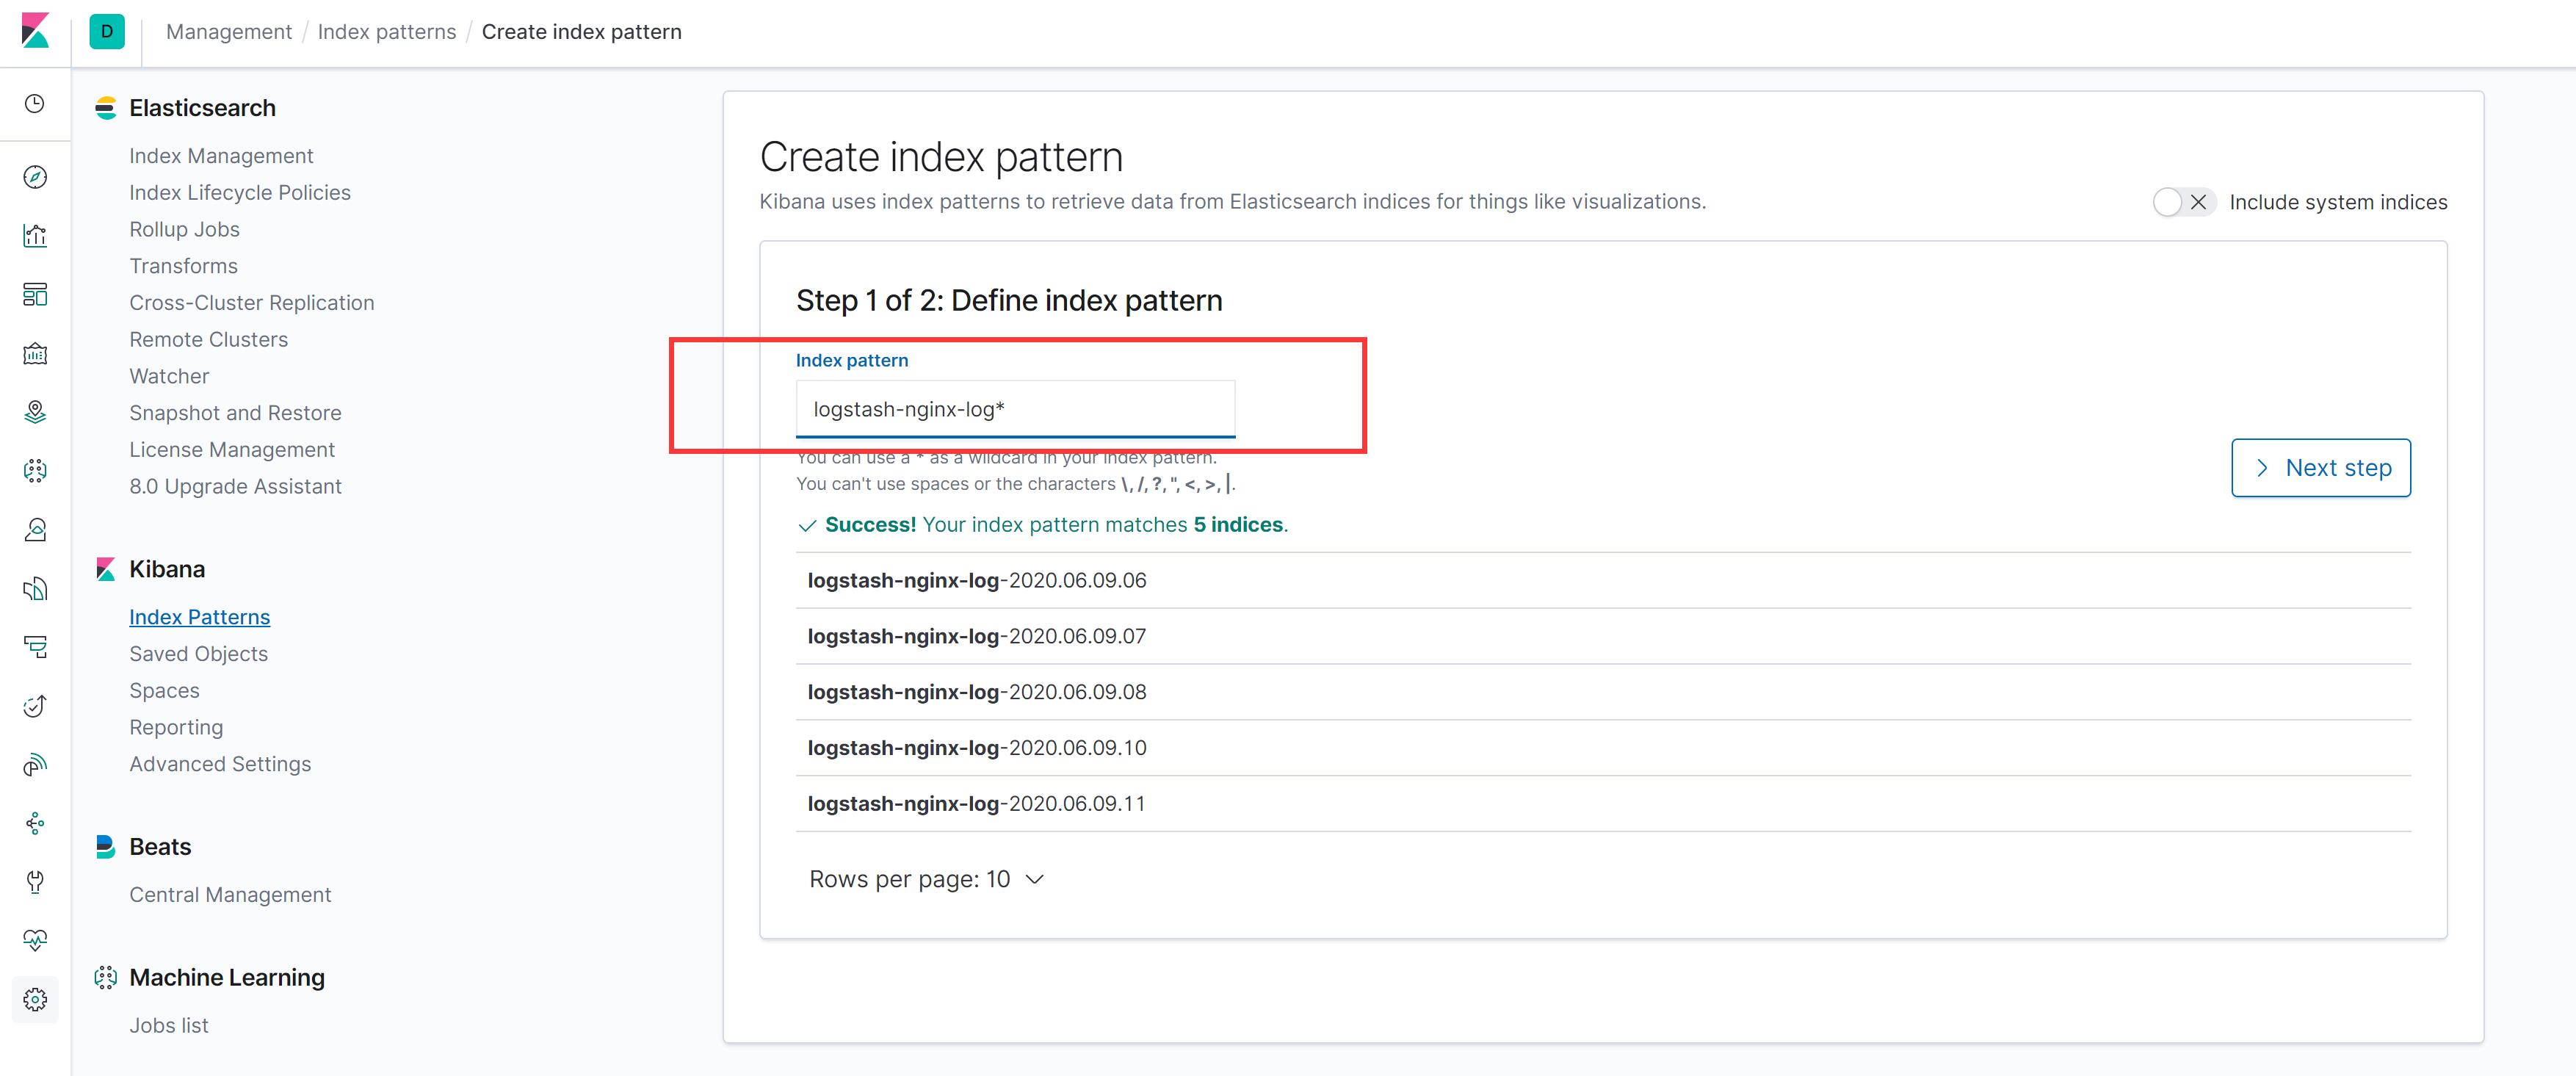
Index Pattern 的名称是由 Logstash 配置的时候确定的:
#logstash/pipeline/nginx.conf

output {

  elasticsearch {
    hosts => "elasticsearch:9200"
    index => "logstash-%{[fields][topic]}-%{+YYYY.MM.dd.HH}"
  }
}
查询日志
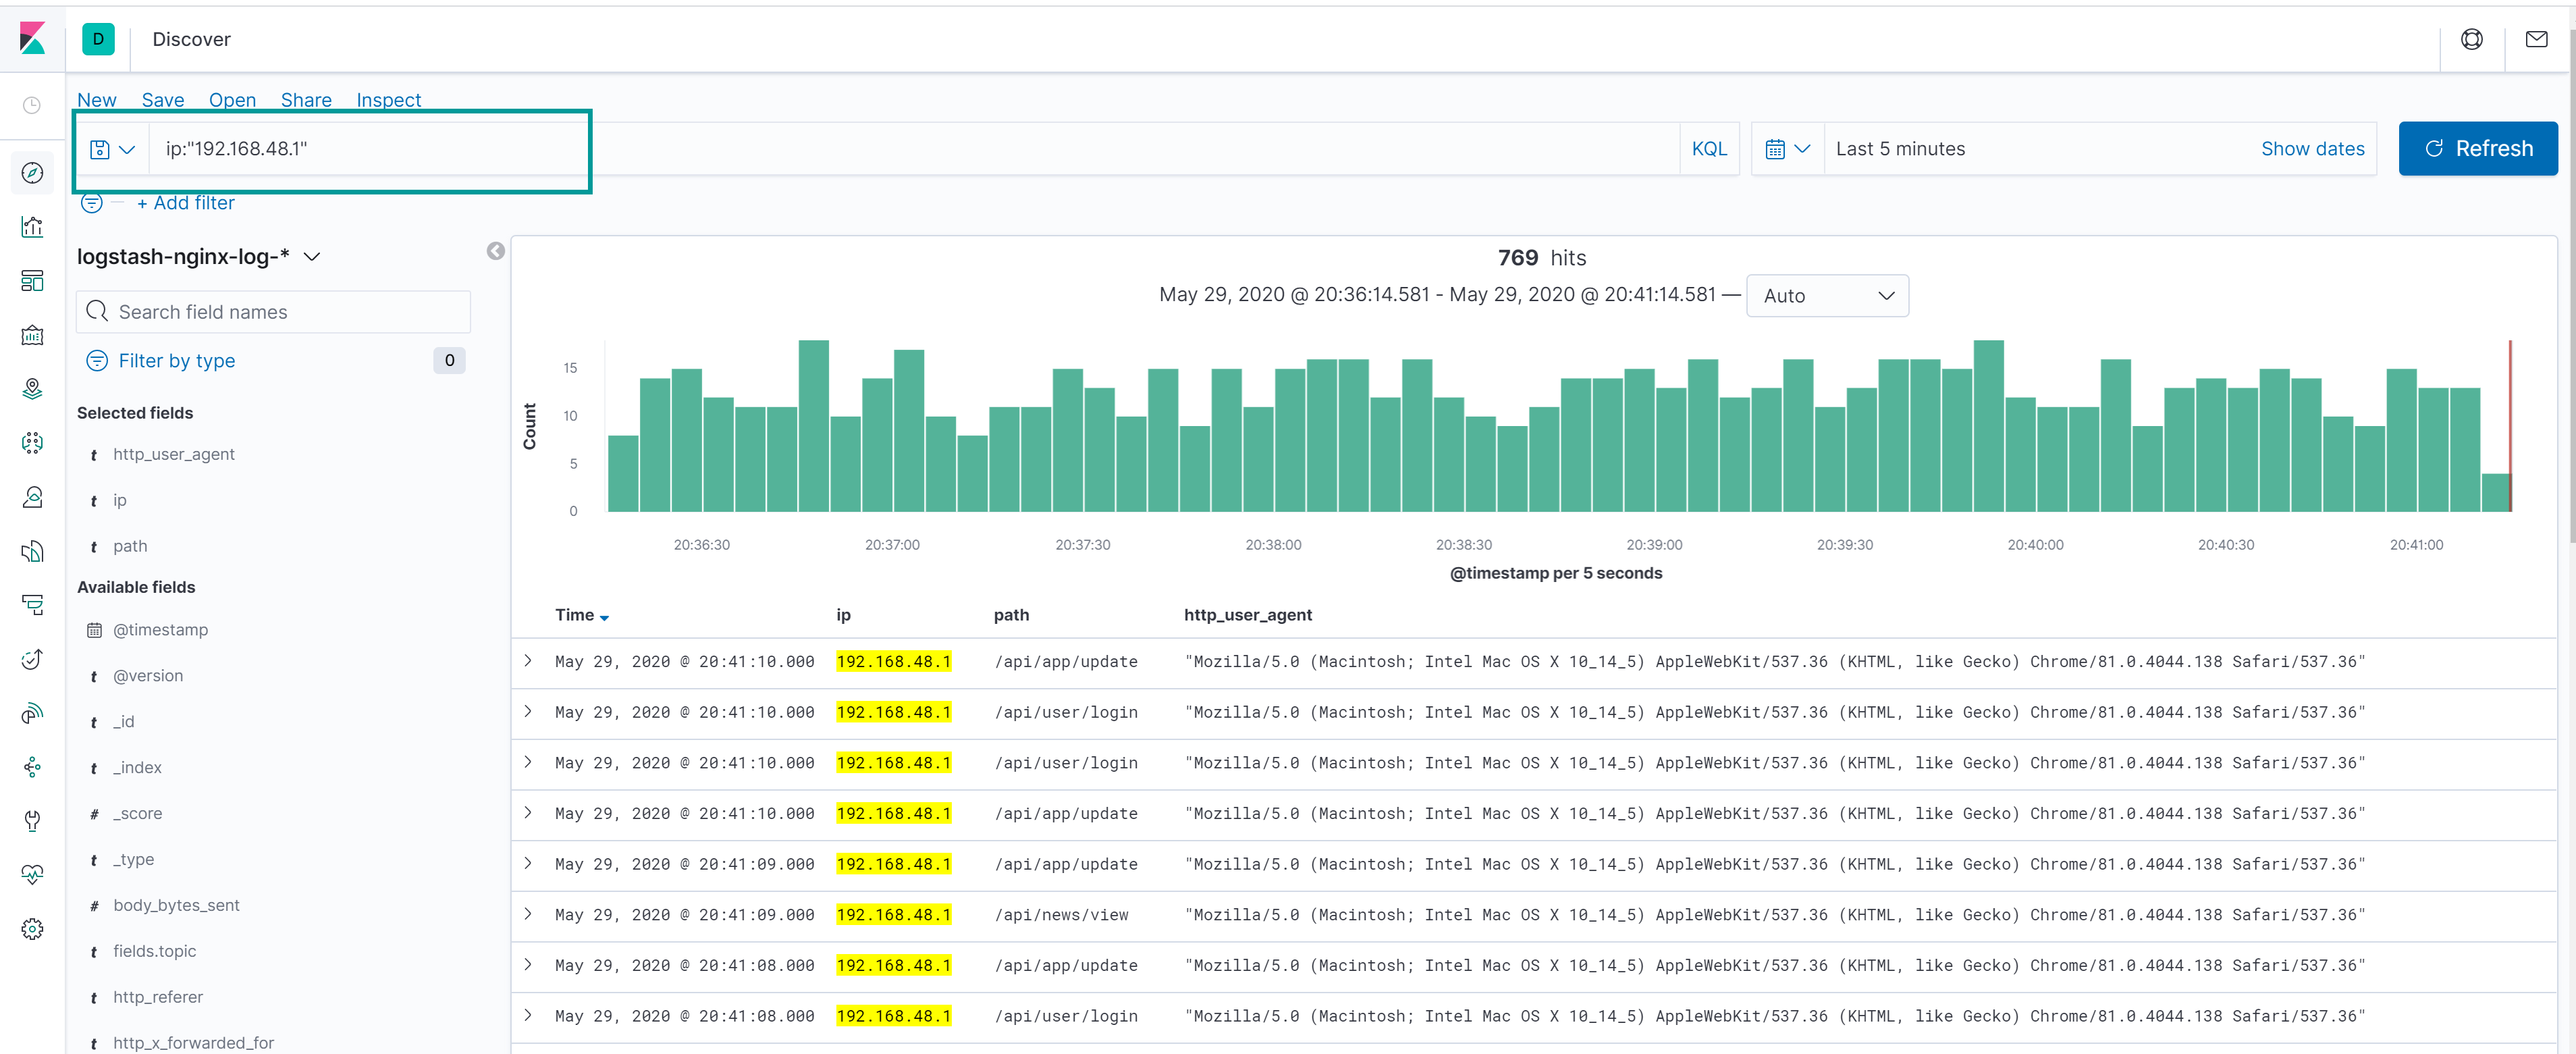
在搜索框输入要查询的字段的值,同时在右侧选择时间区间,就可以开始查询索引的日志:
查询语法
-
精准查询:
ip:"192.168.42.10"path:"/api/user/login"status:404
-
模糊查询:
p_key:"关键词*"
-
AND 与查询:
ip:"192.168.42.10" AND status:404
-
OR 或查询:
ip:"192.168.42.10" OR status:404(ip:"192.168.42.10" AND status:404) OR (ip:"192.168.42.11" AND status:503)
-
NOT 非查询:
NOT ip:"192.168.42.10"
-
比较查询:
status >= 500
更多查询语法,参考 https://www.elastic.co/guide/en/kibana/7.7/kuery-query.html